October CPI rose 0.4%: slower inflation does not mean lower prices
Instructor subject match · Review pending
Headline CPI slowed from September’s monthly pace. A chart and source table distinguish the change in inflation from the level of prices.
What the release says
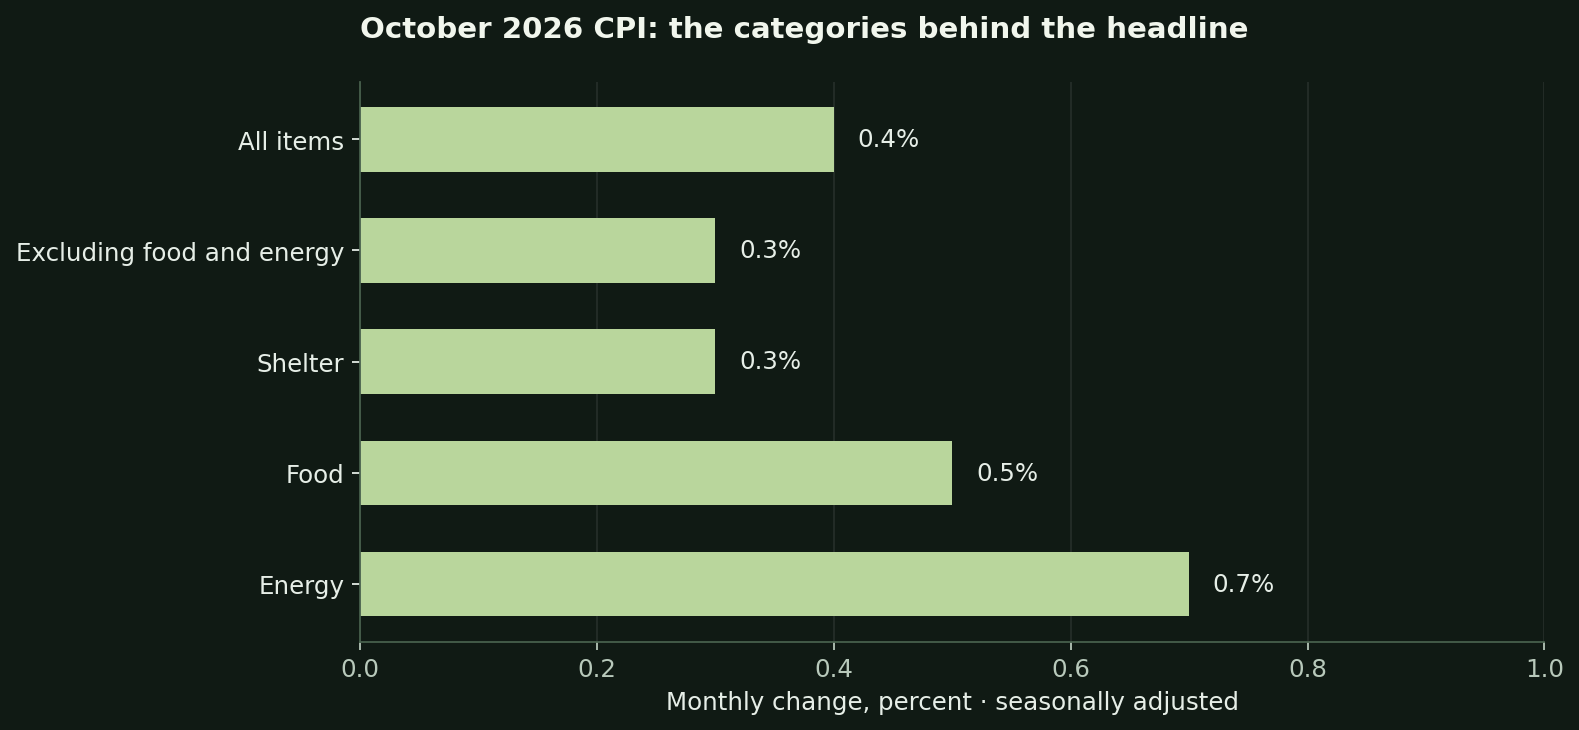
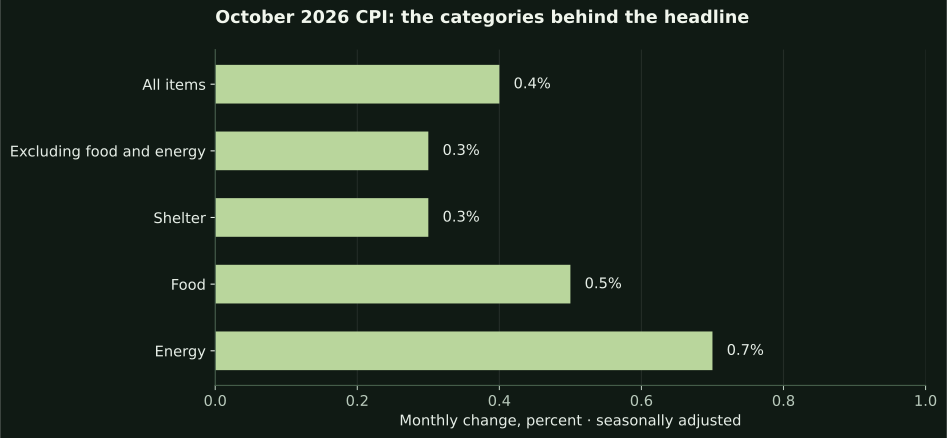
BLS reported a 0.4% seasonally adjusted monthly increase in all-items CPI-U for October, following 0.6% in September. Core CPI, excluding food and energy, rose 0.3%.
In October, shelter rose 0.3%, food 0.5%, and energy 0.7%. These category changes are not additive: the CPI uses expenditure weights.
What the chart measures
The original Lyfter chart plots the published monthly percentage changes. Its zero baseline and common scale make the categories comparable. The table preserves the units, reference month and adjustment basis; it does not estimate missing observations.
The gap between the headline monthly rates is 0.2 percentage points. That subtraction describes the difference between two published rates; it is not a two-tenths-percent drop in the overall price level.
What it means—and does not mean
Think of inflation as a rate of change. A smaller positive change can leave the index higher than it was in the prior month. A household’s own costs can also differ from the aggregate basket.
A useful next check
Before reacting to an inflation headline, write down the period being compared and whether the number is seasonally adjusted. Then identify whether the claim concerns a broad index or a particular spending category. A single monthly observation is not a forecast.
Primary-source documents
The policy and company sources have their own publication dates. This report is dated commentary and education, not a real-time price feed or personal investment recommendation.