Treasury curve snapshot: 10-year par yield at 5.10%, 2s/10s spread at 30 basis points
Human review complete · Owner-confirmed
Original calculations from the Treasury’s November 17 par-yield table: the 2-year and 10-year yields both declined from November 16, while their spread widened by one basis point.

A dated curve, not an intraday quote
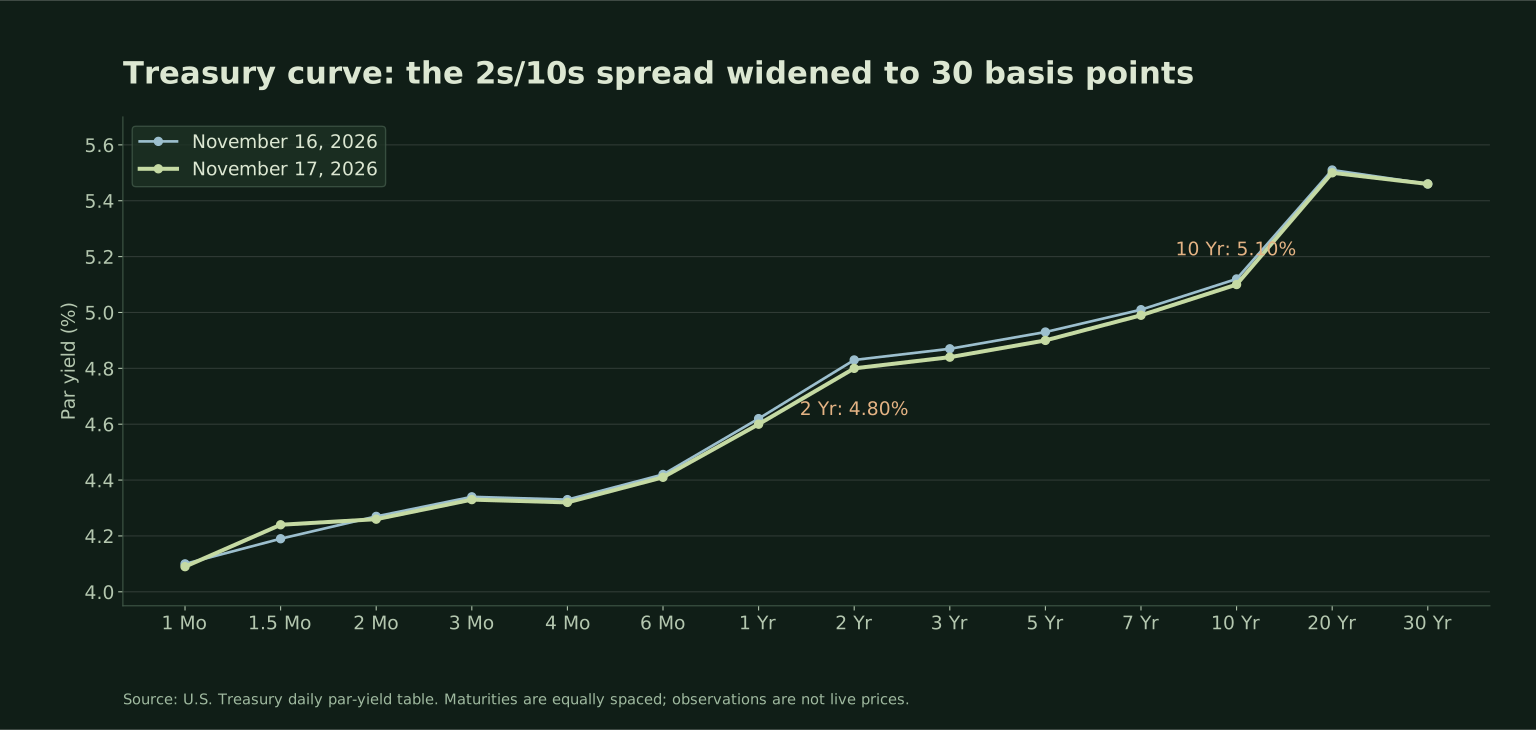
The Treasury’s November 17 daily par-yield table lists the 2-year maturity at 4.80% and the 10-year at 5.10%. On November 16, the corresponding observations were 4.83% and 5.12%. These are dated Treasury reference observations, not live November 18 prices.
The 20-year observation was 5.50% and the 30-year was 5.46% on November 17. The curve therefore does not rise at every adjacent maturity, even though the 10-year yield is above the 2-year yield.
Both yields fell, but the spread widened
Subtracting the 2-year rate from the 10-year rate gives 5.10% − 4.80% = 0.30 percentage points, or 30 basis points. The same calculation for November 16 gives 29 basis points. The spread widened by one basis point because the 2-year fell three basis points while the 10-year fell two.
A widening spread alone does not tell you that yields rose. Record both the level changes and the spread change before describing a curve move. The chart and downloadable table below keep the observation dates attached to each number.
What this snapshot does not establish
The two-day comparison does not identify the cause of the move or imply how bonds will trade next. It also does not describe the return of a particular Treasury security, fund or trading strategy. A maturity’s reference par yield is not a personal investment result.
To compare another date, repeat the calculation with that date’s official observations and preserve the units. The local-model scores below concern the explanation in this report; they are not estimates of bond value, return or forecast accuracy.
4 models. The same article text.
These are subjective opinions about the report’s relevance, explanatory value and visible support. They are not fact checks, asset ratings or forecasts. Each model received the same headline, summary, complete prose and source URLs. Figures and model-output panels were not evaluated. Model identities, exact input, raw outputs and settings are available below.
Read the exact shared input
Treasury curve snapshot: 10-year par yield at 5.10%, 2s/10s spread at 30 basis points

Original calculations from the Treasury’s November 17 par-yield table: the 2-year and 10-year yields both declined from November 16, while their spread widened by one basis point.

A dated curve, not an intraday quote
The Treasury’s November 17 daily par-yield table lists the 2-year maturity at 4.80% and the 10-year at 5.10%. On November 16, the corresponding observations were 4.83% and 5.12%. These are dated Treasury reference observations, not live November 18 prices.
The 20-year observation was 5.50% and the 30-year was 5.46% on November 17. The curve therefore does not rise at every adjacent maturity, even though the 10-year yield is above the 2-year yield.

Both yields fell, but the spread widened
Subtracting the 2-year rate from the 10-year rate gives 5.10% − 4.80% = 0.30 percentage points, or 30 basis points. The same calculation for November 16 gives 29 basis points. The spread widened by one basis point because the 2-year fell three basis points while the 10-year fell two.
A widening spread alone does not tell you that yields rose. Record both the level changes and the spread change before describing a curve move. The chart and downloadable table below keep the observation dates attached to each number.

What this snapshot does not establish
The two-day comparison does not identify the cause of the move or imply how bonds will trade next. It also does not describe the return of a particular Treasury security, fund or trading strategy. A maturity’s reference par yield is not a personal investment result.
To compare another date, repeat the calculation with that date’s official observations and preserve the units. The local-model scores below concern the explanation in this report; they are not estimates of bond value, return or forecast accuracy.

Primary sources:
https://home.treasury.gov/resource-center/data-chart-center/interest-rates/TextView?type=daily_treasury_yield_curve&field_tdr_date_value_month=202611
Inputs, raw responses & settings (JSON) · Individual scores (CSV)
Run locally on Venus with a shared model lock and temporary cooling controls. GPU offload and CPU work can be combined; this is an editorial comparison, not a hardware or accuracy benchmark. Models did not browse the sources.
Primary-source documents
The policy and company sources have their own publication dates. This report is dated commentary and education, not a real-time price feed or personal investment recommendation.